How Did The Week Go?
If you’re new here: OneCamp is a self-hosted workspace (chat, tasks, docs, calls, calendar and AI agents) that you install on your own server. It is open source and free for up to 25 people.
Every team lead asks the same few questions on a Friday afternoon. What got done this week? Is work coming in faster than it goes out? What’s overdue, and whose is it? Did we finish things when we said we would?
Until now OneCamp answered these one project at a time. Reports answer them across every project you’re in.
A report for the weeks you choose
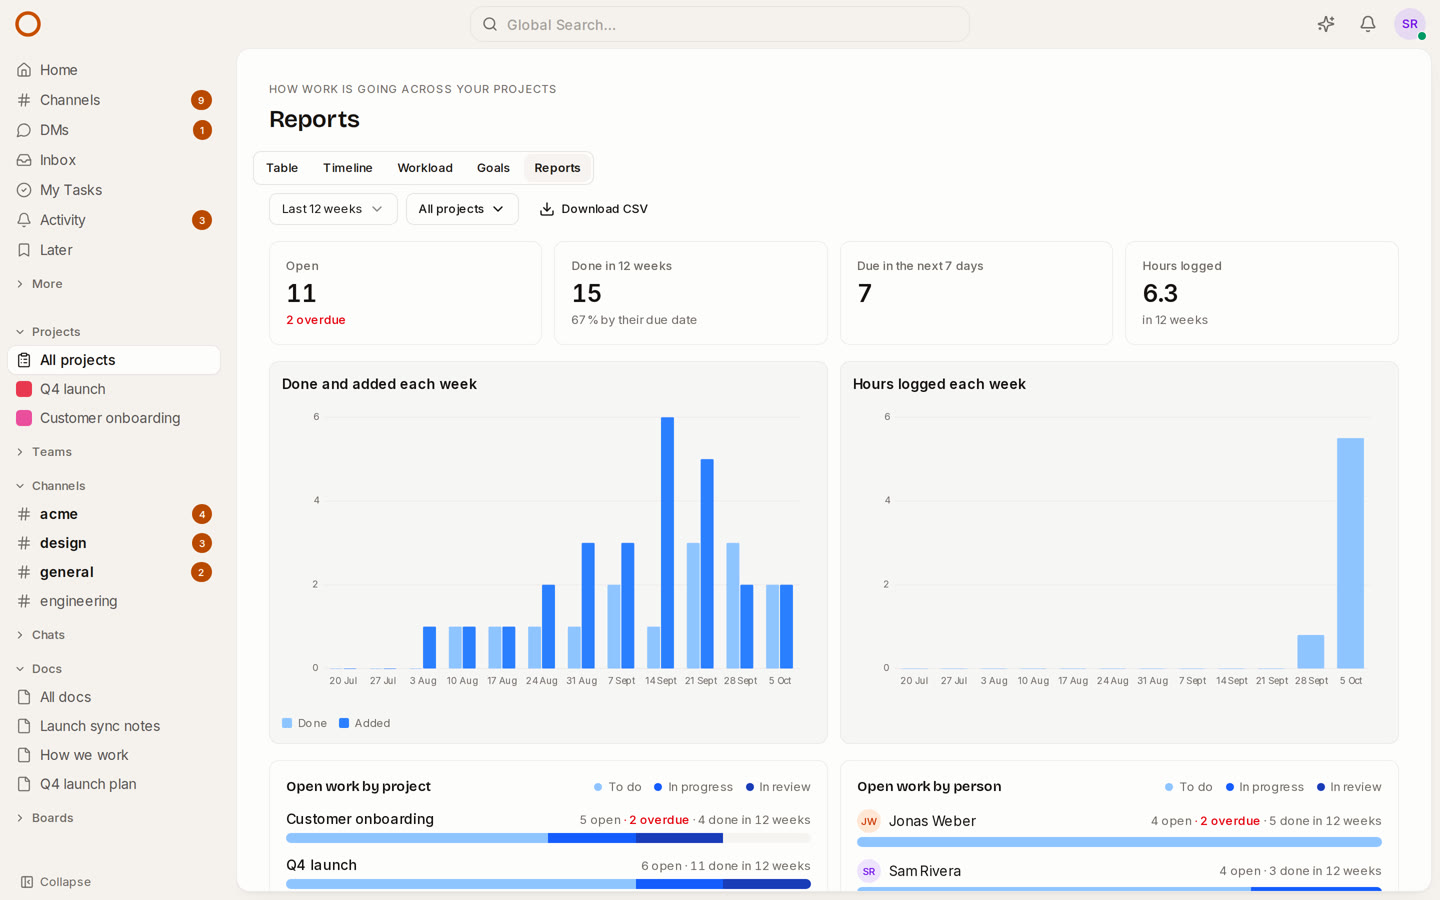
Open Projects and choose Reports (or press Ctrl/⌘ K and type “reports”). Pick the last 4, 12 or 26 weeks, and all your projects or only the ones you care about this week. The report shows:
- Open work, and how much of it is overdue.
- What got done, and what share of it was done by its due date.
- What’s due in the next 7 days.
- The hours logged on the projects’ tasks.
- Done and added each week, side by side. If the second bar keeps winning, the backlog is growing, whatever anyone says in standup.
- Open work by project, by person and by priority, each split into to do, in progress and in review, with the overdue part called out.
Download CSV gives you the same numbers for a spreadsheet or the Monday slide.
What counts, and what doesn’t
Only the projects you’re in, and only live ones. Subtasks count, as they do in the projects overview. A project’s own statuses count as the stage they belong to, so a “QA” status set up as part of review counts as in review. A cancelled task counts as added but never as done. Tasks assigned to an agent or another bot count in the totals, but not as anyone’s load.
Weeks start on Monday in your time zone, so “this week” is the same week your calendar shows.
How it compares
- Asana keeps dashboards across projects (portfolio dashboards) for its Advanced plan.
- monday.com limits how many boards one dashboard can combine by plan: one on Basic.
- ClickUp dashboards are deeper if you want to design your own widgets.
OneCamp’s reports are one opinionated page rather than a dashboard builder, and they’re in every edition, including the free one for up to 25 people, on your own server.
Also in this release
- Docs open sooner. A doc shows its saved text straight away while the live editor connects, then switches over in place. The “Reconnecting” banner now shows only when a connection really drops.
- Charts read cleanly. Axis ticks fall on round numbers, and counts are never fractions.
- Projects on a phone keep their header in place while they load, instead of pushing the list down.
- Without AI, charts now draw. In the edition without AI, charts in table views and documents showed a placeholder box. They now draw the real chart, the same one reports use.
Try it
- Open the live demo on the reports. It has two projects, Q4 launch and Customer onboarding, with weeks of finished work behind them.
- On your own server: onemana.dev/free gives you the install command, no email needed.
- The guide: Reports.
- Already running OneCamp? Update to v2.62.0 (with AI) or v1.47.0 (without AI).